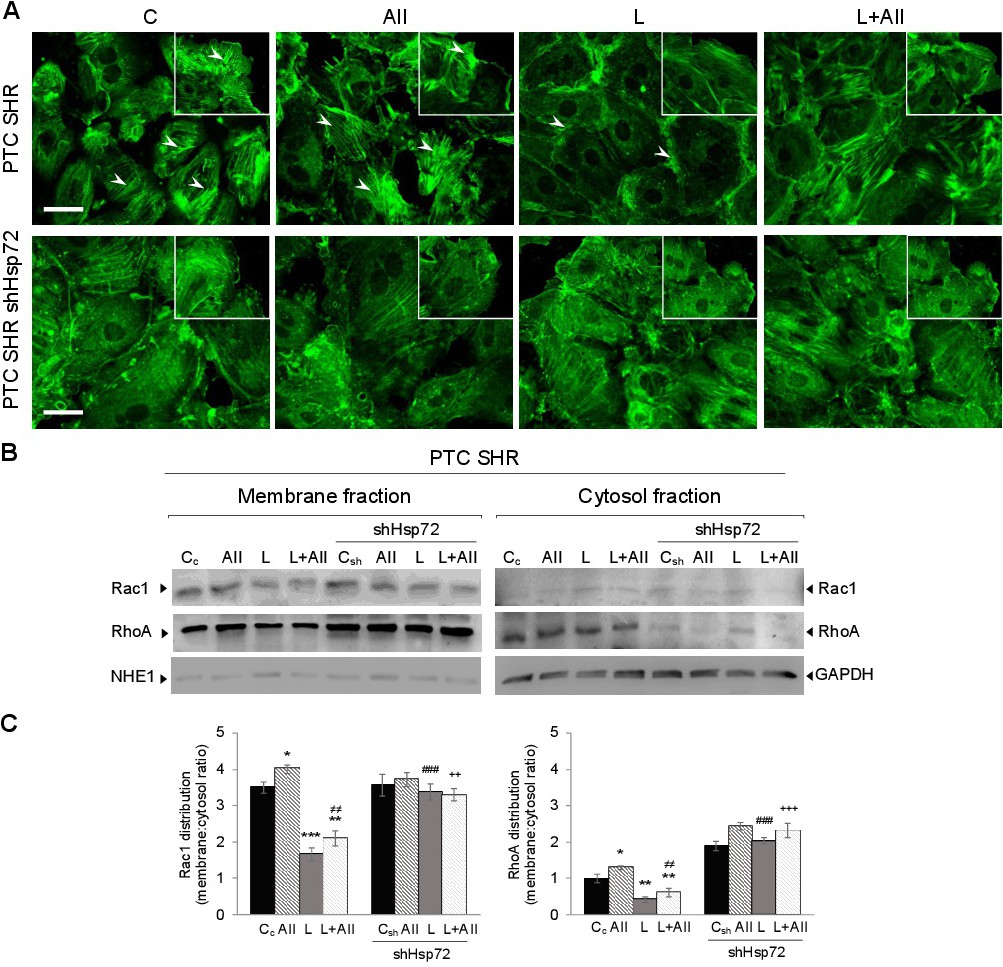
Fig. 1. Analysis of Hsp70 within the Losartan effect on PTCs cytoskeleton stabilization. A) SHR PTCs (upper panel) or shHsp72 Knockdown SHR PTCs (lower panel) cells were subjected to different treatments: Control (Cc or Csh), Angiotensin II (AII), Losartan (L) or Losartan plus Angiotensin II (L+AII). To visualize actin cytoskeleton, the cells were stained with anti-β actin and analyzed by immunofluorescence. Fluorescence micrographs show actin cytoskeleton (white arrowheads). Inset: cells stained show protrusions at the leading edge (top right). Pictures display representative areas of staining from 3 independent experiments. Bar: 50 μm. B) Relative abundance of Rac1 and RhoA on SHR PTCs and shHsp72 knockdown SHR PTCs in membrane and cytosol fractions was determined by Western blotting. Cells were subjected to different treatments. NHE1 and GAPDH were used as membrane and cytosol loading control respectively. C) Band intensities were quantified by densitometric analysis and data are expressed as membrane-to-cytosolic ratios. Bars means ± SEM, n=3. *p≤0.05; **p≤0.01; ***p≤0.001 vs SHR PTCs control group (Cc). ## p≤0.01; ### p≤0.001 vs SHR PTCs (L). ≠≠ p≤0.01 vs SHR PTCs (AII). ++ p≤0.01; +++ p≤0.001 vs SHR PTCs (L+AII).